PREFACE
Simply investing in an idea that Amazon.com Inc (NASDAQ:AMZN) stock won't face a serious stock decline has so outperformed owning the stock out-right that it's almost inconceivable -- but these are the facts, and they are not disputed.
STORY
Selling out of the money put spreads is an option investment that has a very clear belief system: The underlying stock simply will not go down a large amount. If that reality exists, the returns can be substantially larger than simply owning the stock.
But, with some care, we can turn that strategy into one with even less risk, and still get the out-sized returns -- and that is what we see with Amazon.
DISCOVERY
Let's look at selling a put spread in Amazon every week, but also putting a further layer of protection by putting in a stop loss. Here is the difference in the profit loss graph, where the red line is a normal short put spread and the blue line is a short put spread with a stop loss added.
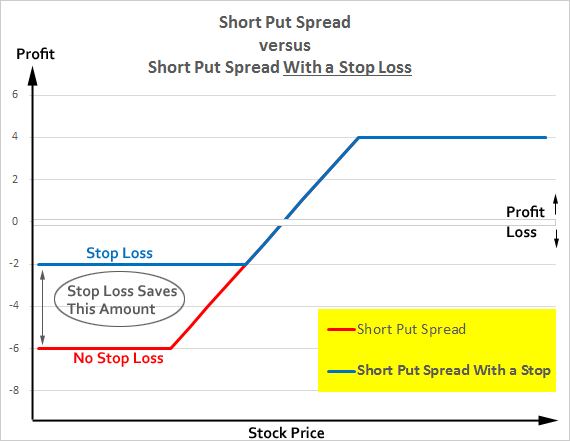
We can see a normal short put spread does have a risk control in place -- there is a maximum loss. But, adding in a stop loss makes the maximum loss even tighter. Applying this to Amazon.com Inc (NASDAQ:AMZN) has been a staggering winner. science option strategy has been the real news and one of the best performers over the last two-years, one-year and even six-months.
OPTIONS
Here is how that risk adjusted short put spread has done in Amazon over the last two-years:
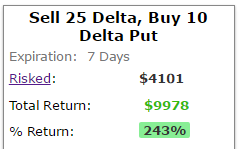
That's a 243% return simply because the stock didn't collapse, while the stock price itself was up 127%.
IT WORKS CONSISTENTLY
What we need to do now is look at this short put spread over various time periods. We see that it has worked over the last two-years, now let's look at the last year:
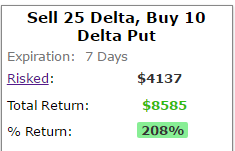
We see a 208% return. And, to add context, here is how this option strategy has done relative to the stock.
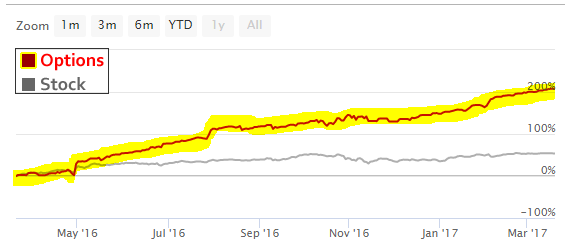
The gray line is the stock price, up 54%, while the highlighted line is the option strategy, up 208%. Yes, nearly a quadrupling of the stock return, using a risk protected option strategy. Here is how it has done over the last six-months:
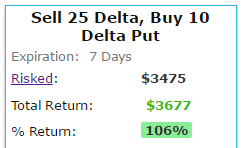
That's a 106% return, versus the stock return of 10%, or more than a 10-fold increase. For completeness, here again is the stock chart versus the option chart:
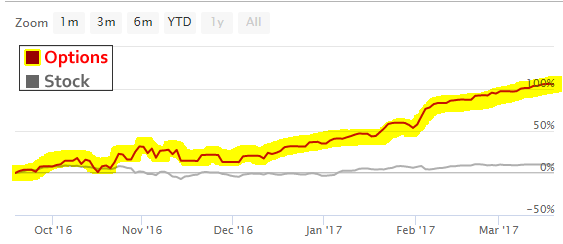
It's not a magic bullet -- it's just access to objective data.
What Just Happened
This is how people profit from the option market - it's preparation, not luck. To see how to do this for any stock or ETF and for any strategy, with just the click of a few buttons, we welcome you to watch this 4-minute demonstration video:
Tap Here to See the Tools at Work
Thanks for reading.
Risk Disclosure
You should read the Characteristics and Risks of Standardized Options.
Past performance is not an indication of future results.
Trading futures and options involves the risk of loss. Please consider carefully whether futures or options are appropriate to your financial situation. Only risk capital should be used when trading futures or options. Investors could lose more than their initial investment.
Past results are not necessarily indicative of future results. The risk of loss in trading can be substantial, carefully consider the inherent risks of such an investment in light of your financial condition.